There are several tricks you can use to be super-productive as a developer, but one of the most beneficial is the ability to have real-time feedback on the code you are writing. Today, I’m going to shine a spotlight on a product that I’ve grown to love: NCrunch.
NCrunch allows you to execute your project’s tests in real-time as you type. But it doesn’t stop there. NCrunch also adds to the arsenal of tools that you can use to determine the performance of the code you’re writing, as well be able to watch your code-coverage in real time. Let’s go over some of these features 1-by-1.
Real-time Test Runner with NCrunch
That’s right, once you enable NCrunch for your project, it will begin to discover all of the tests in your solution – and then it will start executing them. Right then and there. When you make a change to a test – or code that is covered by a test – it will re-run the test and give you feedback on if it passed or failed. You don’t even need to save the file – just stop typing for a few seconds, and the test will run! You can actually see the results in the left margin of the code as soon as the test(s) complete.

To demonstrate, I’ve purposefully modified the above code to fail:

Make note that the yellow bar in the gutter indicates I haven’t saved the file yet – and the red dot is now showing the covering tests have failed. By simply clicking on the red dot, I can then drill in to find out which test(s) failed:

And by double clicking on the test, it will take you to the actual test’s code, so you can easily see which test it was.

Once you are in the test code, you can see what the exception was. As would be expected by this change, a NullReferenceException was thrown – so you’ve now been able to see cause & effect of the change in just a few seconds.
Then, if you switch to the NCrunch pane and view the Trace Output section, you can see the entire stack trace of the issue that is occurring.

Test Coverage
You can use the same trick you used to keep track of the failed tests to determine code coverage on a line-by-line basis – it even shows you which parts of if-else-statements have been executed, or which lines aren’t being tested due to an early exit. This helps you find conditions in your tests which you need to add coverage for. In the below screenshot, you can see that the first condition is the only thing tested because the dots turn white after that – we need to add a test to handle the next possible value in the UserType enum. (I’m sure it was just an oversight! ðŸ˜)

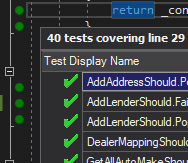
And if we want to identify all the tests covered by any particular line of code, you can use the same trick as on the red dots – just click the dot and a popup will appear giving you a list of all the tests covering it:

Performance!
Again, real-time feedback is your friend. Find performance problems before they even leave your machine. And guess what? It involves those same dots that tell you if you code passed or failed – when a line of code runs significantly slower than the code around it, it will show up with a yellow dot instead of green. This is your warning that there may be something to look into. Hover the dot, and it will show you the Total, Max, and Average execution time for the statement. Since this is a database call, and likely the database wasn’t warmed up on the first run, we can see that the call was slow at least one time, but on the average it isn’t so bad.

Test-Driven Design
If you are a fan of TDD like most of us here are, this tool is invaluable for allowing you to write your failing test first, then add your implementation logic, and then breathe a sigh of relief when you add the last piece of the puzzle that turns everything green again.
Using NCrunch: Conclusion
Yeah, this turned into a bit of a product review, but good tools are sometimes hard to find! But, here at Clear Measure, we’re always looking for ways to produce stable code in the fastest way possible. This is just one tool to keep in your toolbox next to Visual Studio & ReSharper. If you want to increase your productivity, the real-time feedback provided by NCrunch is something you may also find invaluable. They have a free trial as well, so give it a spin and see how you like it! Check it out at https://www.ncrunch.net/!
Originally published October 29, 2020. Information refreshed April 10, 2022.


